

Applications
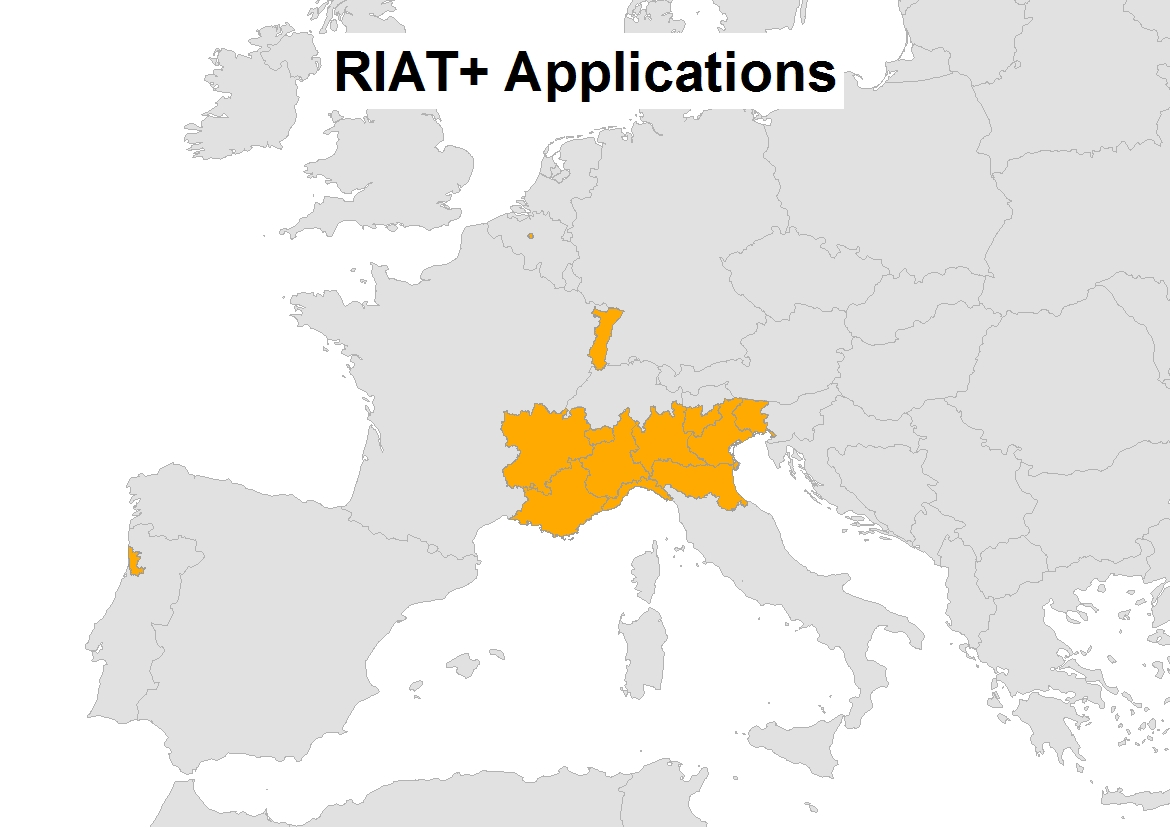
RIAT+ has been already tested and applied in different EU Regions with various aims:
 |
OPERA Project (2013) In Emilia-Romagna Region in the optimization way to estimate the effectiveness of measures (both technical and efficiency measures) contained in the AQP and in Alsace Region in the optimization way to support the implementation of an action plan like SRCAE (Regional Scheme on Climate, Air and Energy) identifying the most effective technical and energy measures |
| VALUTA Project (2014) In Lombardy Region in scenario mode to estimate the costs and the benefits of both technical and efficiency measures contained in the AQP |
|
| APPRAISAL Project (2015) In Brussels Capital Region in scenario mode to evaluate a reduced set of traffic and domestic heating measures provided by BIM, responsible for the study, monitoring and management of air, water, soil, waste, noise and nature and in Porto Region in the optimization way applied in Great Porto Area to focus the AQP on RIAT+ selected measures |
|
| CLIMAERA Project (2018 - 2020) Through a synergistic approach between climate-air-energy policies, the project proposes to deal with the impacts due to Climate Change on air quality throughout Central Europe, including the Alpine and Mediterranean regions. |
|
| PREPAIR Project (2018 - 2022) PREPAIR (Po Regions Engaged to Policies of AIR) aims at implementing the measures foreseen in the regional plans and in the Po Valley agreement at a larger scale so to strengthen the sustainability and durability of results. |
Emilia-Romagna and Alsace Region have been the first case studies used during Opera project to design and implement RIAT+ tool answering regional requirements in air quality planning. Afterwards RIAT+ has been employed in "Progetto VALUTA" of ARPA Lombardia. Next, RIAT+ has been exploited in the final step of the APPRAISAL project: it was the application of the IAM tool RIAT+ in two test cases, one in the Brussels Capital Region in Belgium and in the region of Porto in the North of Portugal. The experience obtained through these two test cases was used to further improve the Guidance Document (goal of the APPRAISAL project). Now, within two new projects (CLIMAERA and PREPAIR) RIAT+ will be applied to with the aim of evaluating the measures foreseen in the regional plans and in the Po Valley agreement.
ALSACE case study (2013)
Example results for the optimisation of the mean NO2 concentration (in the sensitive zones, for the whole year) and its side-effects on NO2 in winter, PM10, PM2.5 and ozone (SOMO35) are shown in Figures below.
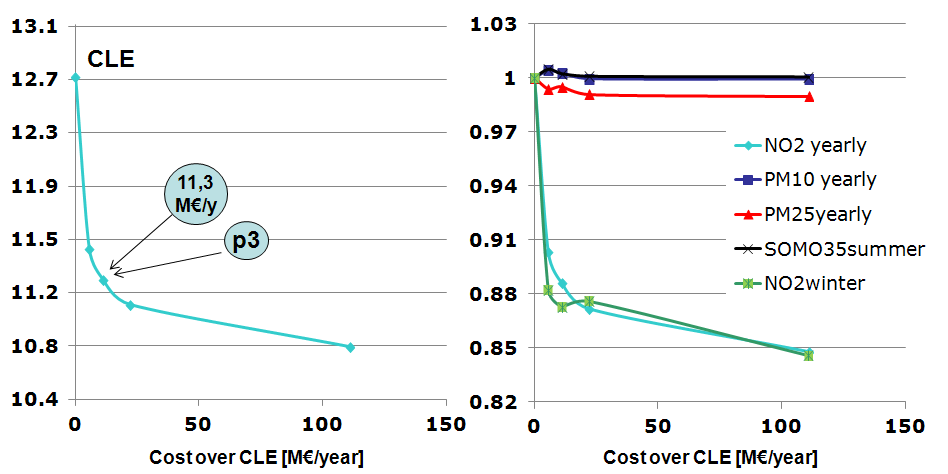
Results for the optimisation of NO2 (Pareto curve for NO2 yearly average concentrations, left) and contemporary Pareto for PM10 and ozone (right).
The Pareto curve (a curve providing the optimal solutions ranked by costs) shows five possible combinations of reduction measures and their cost and AQI. For the third point (p3) of the Pareto curve, following figure shows that emission reductions of NOX essentially occur in the sector “8: other mobile sources”, “7: road transport” and sectors “1: combustion in energy and transformation industries”. Costs (~11 M€/year above those requested by the Current Legislation) are mainly assigned to sectors 1 and 8.
RIAT+ produces a list of the measures and of their penetration to obtain these reductions.
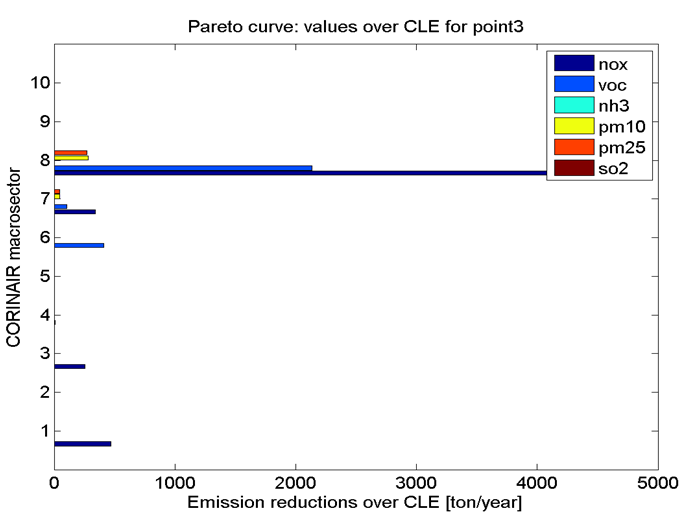
RIAT+ emission reductions corresponding to point 3 of the Pareto curve (about 11 µg/m3 for NO2 average yearly concentration).
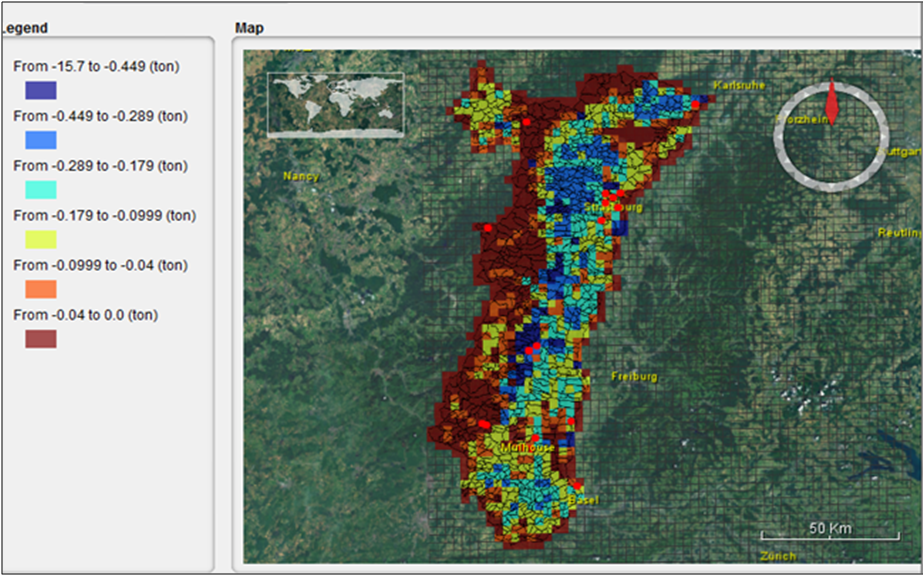
Absolute reduction of PM10 emission, obtained with RIAT+.
EMILIA-ROMAGNA case study (2013)
The emission scenarios and the resulting air pollution simulations have been produced on a domain grid covering the Emilia-Romagna region and the surrounding areas which influence the regional air pollution. The gridded emissions (year 2010) were prepared using the tool eFESTo. Air pollution concentrations have then been simulated for the year 2010 using NINFA (www.arpa.emr.it) computing air quality indicators (AQI) and producing source/receptor models. Different subdomains for the optimization have been defined: the whole Emilia-Romagna, nine Provinces, four “European reporting zones”, and the so-called “sensitive zone”. First, RIAT+ has been applied to the optimization of the yearly PM10 average on the whole Emilia-Romagna; the resulting Pareto curve is represented in the figures below showing five points each representing different optimal combinations of reduction measures. Pareto curve’s y-axis represents the pollution level as a spatial averaged over the whole domain in percentage reduction respect to the CLE 2020 value (1st point in the Pareto curve). The costs (x-axis) are indicated in percentage as values beyond CLE 2020 scenario.
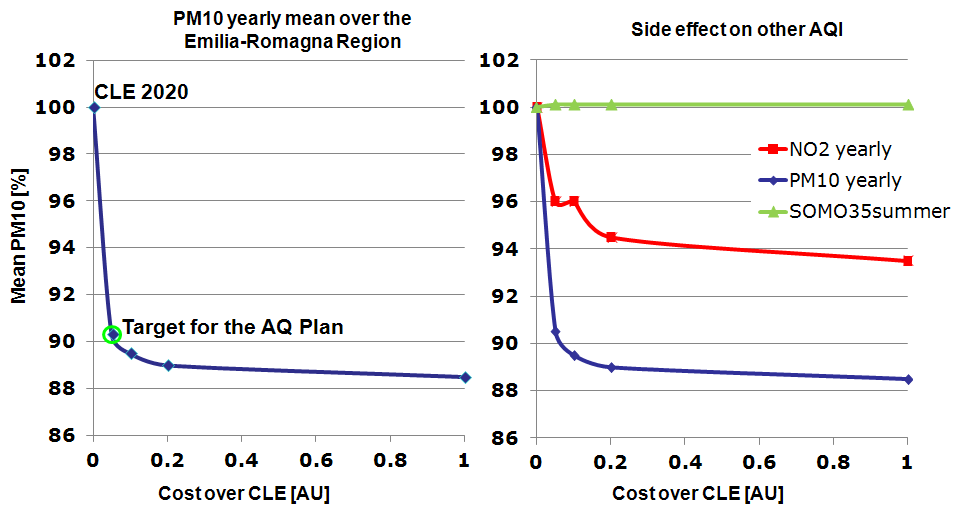
Pareto curve for the optimisation of PM10 (yearly average concentrations in blue, and the corresponding effect on NO2 in red and ozone - AOT40 in green).
Analysing emission reduction (following figure) corresponding to point 3 of the Pareto curve, it can be seen that a significant reduction of NH3 should be reached acting on agriculture macrosector, while NOX reduction should be obtained through transport and other mobile sources macrosectors. Actions on residential heating should be promoted to reduce a large part of primary PM10 emission.
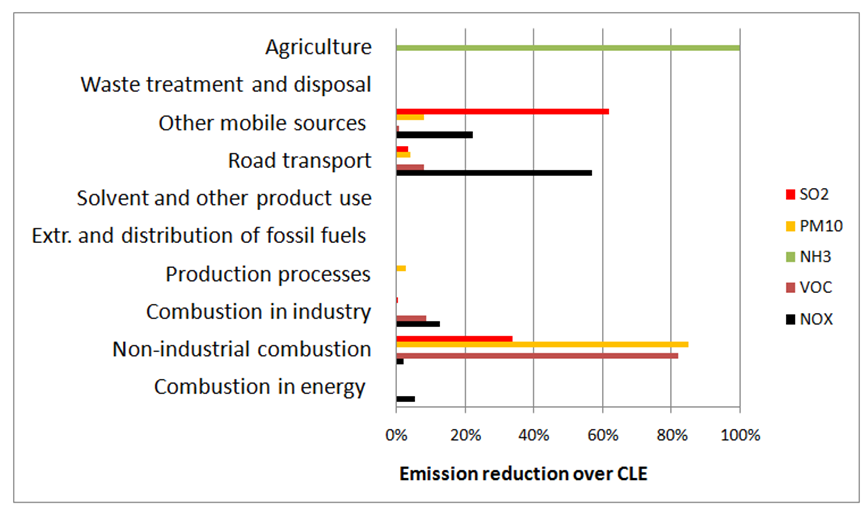
RIAT+ emission reductions corresponding to point 3 of the Pareto curve.

Average PM10 concentrations resulting in RIAT+ (point 3 of the Pareto curve).
LOMBARDY application (2014)
VALUTA project was completed in December 2014 and focused on the application of RIAT+ to the abatement measures of Regional Air Quality Plan Actions (PRIA). Lombardy Region has commissioned the study to ARPA Lombardia. The objective was the evaluation of the costs and benefits associated with the operations covered by PRIA. The Lombardy Regional Air Quality Plan Actions of the Region (July 2013) consists of 66 measures divided respectively: 26 concerning with to the macro-sector "Road Transport and mobility", 27 concerning with to the macro-sector "Stationary Sources and rational use of energy "and 13 concerning with to the macro-sector "activities for agriculture and forestry ". The study evaluated the costs and benefits of all the measures.
The study led to a rough economic assessment of implementation of the PRIA, of the direct benefits of the measures taken (in terms of energy savings) and the benefits to public health related to the improvement of air quality, also evaluating economic terms.
Brussels case study (2015)
The Brussels Capital Region (BCR) has an area of 161 km² and is home to more than 1.1 million people. The region consists of 19 municipalities, one of which is the Brussels Municipality, the capital of Belgium.
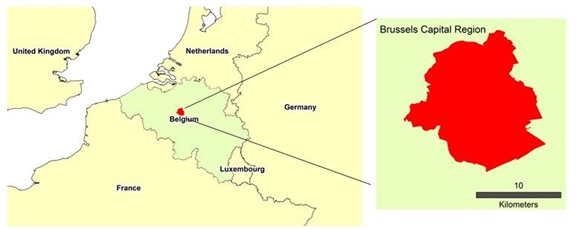
Brussels Capital Region.
The proposed abatement measures are provided by BIM (Brussels Environment): they are a list of 13 measures consisting of 9 traffic measures and 4 domestic heating measures, that have been approved by Brussels authorities. For these abatement measures, BIM provided order-of-magnitude estimations of the costs and emission reductions.
The RIAT+ database with abatement technologies that are available for the macro-sectors of interest non-industrial combustion (2) and transport (7) was derived from GAINS Europe (link) in the frame of the OPERA LIFE+ project.
For air quality modelling of the BCR, the AURORA chemical transport model (link) was used with a domain of 49 x 49 grid cells at 1 km resolution with base emissions for the year 2009. For the vertical discretization, 20 layers were used for a domain extending up to 5 km.
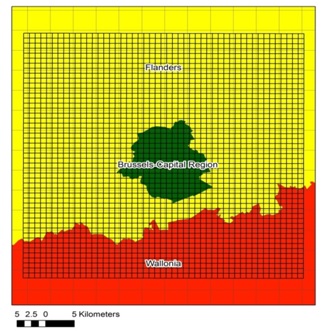
Brussels domain simulation
The results of the 1 km resolution model setup were validated by comparison to the observed values at the measurement stations inside the model domain. For the model validation, the FAIRMODE methodology (http://fairmode.jrc.ec.europa.eu/) was adopted.
For the Design of Experiment phase, three levels of emission reduction were distinguished: base case (B), high emission reductions (H) and low emission reductions (L). In order to determine the emission reduction scenarios for the ANN training, the three levels B, H, L were combined to produce 14 emission scenarios. These scenarios were applied to the emissions both in and outside the policy application domain (PAD), which, in this case, is the BCR.
In this study, the AQIs considered are:
· PM10: yearly average of PM10 concentrations
· NO2: yearly average of NO2 concentrations
Once the ANNs have been trained, RIAT+ was run to look for optimal policies beyond the 2020 Current LEgislation. As the emission changes, that can be obtained with the selected set of measures, are limited, unsurprisingly, the concentration changes are also limited. Figure 16 shows an example of NO2 concentration changes due to the emission abatement measures.
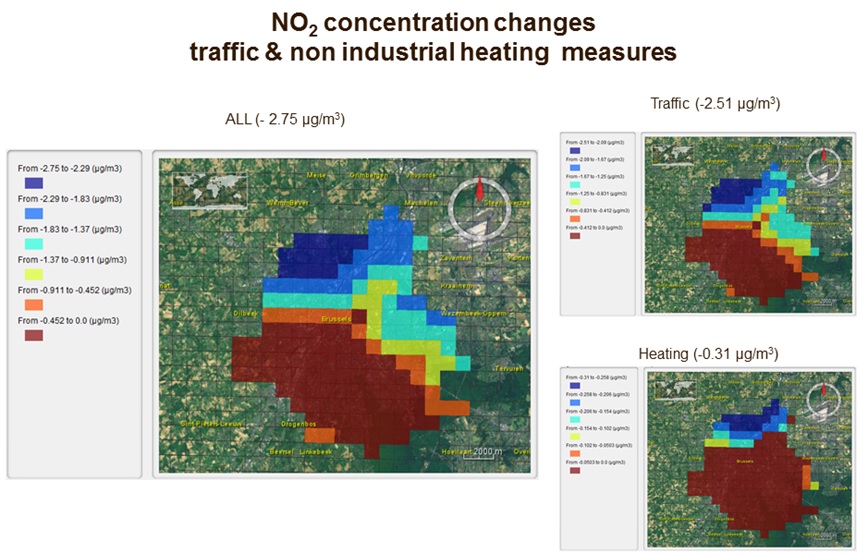
Brussels simulation results
PORTO case study (2015)
The Great Porto Area is a Portuguese NUTS3 subregion involving 11 municipalities. It covers a total area of 1024 km² with a total population of more than 1.2 million inhabitants.
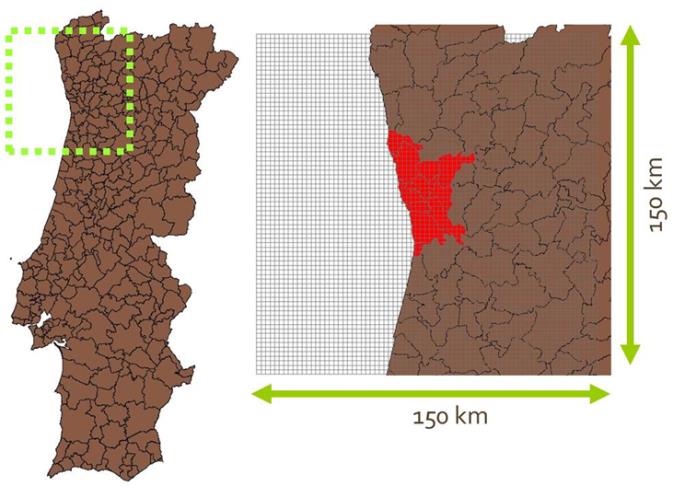
Porto domain simulation
The GAINS database of reduction technologies, which contains a large data set collected for Portugal by IIASA (http://www.iiasa.ac.at), was used. It contains values for the years 2010, 2015, 2020 and 2025, including costs and emissions effects. The reference scenario "TSAP" of March 2013 was considered in the study.
The TAPM model was applied to the Great Porto Area (150x150 km) for one entire reference year (2012) with a 2x2 km² spatial resolution using disaggregated emissions from the Portuguese 2009 emission inventory, which is the most recent available. Extending previous evaluations of the same model for the Great Porto Area, the results of the TAPM simulations were compared to the measured values at the monitoring stations inside the model domain. As in the Brussels case, the FAIRMODE methodology was used for the validation (http://fairmode.jrc.ec.europa.eu/).
The Design of the Experiment was influenced by the computational time constraints, so just 10 emission reduction scenarios were simulated. Processing the TAPM simulation results, low and high reduction levels were obtained. Each TAPM simulation is a full year simulation. The target considered in this application was the PM10 annual mean.
RIAT+ was applied in the optimization mode and the following figure shows the efficient solutions obtained for the Great Porto domain. On the horizontal axis of the figure, there are industrial costs (i.e. those related to the implementation of end-of-pipe measures), considered over CLE (i.e. those mandatory under the current legislation) and expressed in M€. On the vertical axis, there is the spatial average of PM10 annual mean (the AQI value for this particular case) estimated over the entire study area.
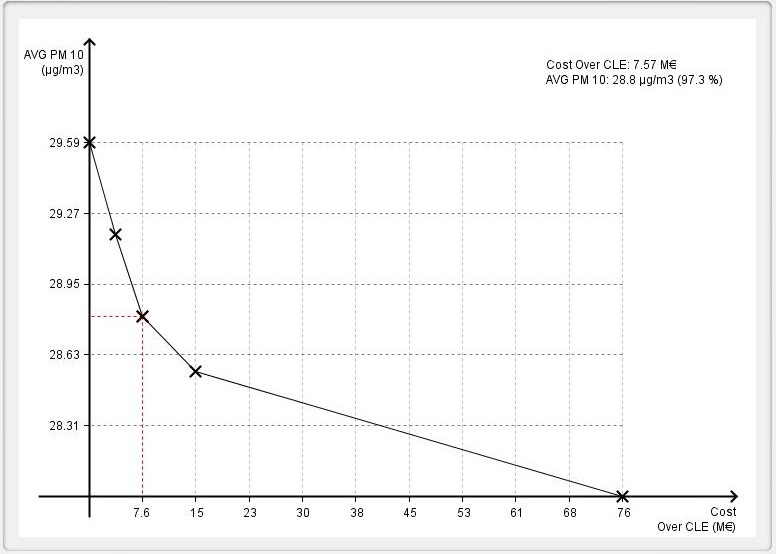
Pareto curve
The Pareto Curve shows that a PM10 mean concentration of 28.8 µg/m³ can be reached by adopting emission reduction technologies costing around 7.6 Million € per year.
For that point of the Pareto curve, next figure shows the spatial distribution of PM10 annual concentration values. The largest reduction of PM10 emissions and concentration levels are expected over the Porto municipality where the population has the highest density.

Results for point 3 of Pareto Curve
 |
 |
 |
 |